Monitoring Your Distribution
After setting up your first distribution, your next step will likely be monitoring to ensure it's working correctly. You can do this in several ways.
Check the Status in the Integration Portal
To view the current status of your distribution, visit the Integration Portal and confirm that your distribution is enabled and configured correctly.
Click on the View & Edit link to see details such as uptime and statistics for the last 24 hours. You'll also see a small chart that provides a quick overview of how many messages were sent through this distribution during that period.
Monitor the Status with Prometheus / OpenTelemetry
If you want more advanced monitoring, including historical data and alerts, you can integrate Prometheus to scrape metrics from our system. This feature is available for all integration portal users and provides detailed data for each running integration.
To visualize the data, we recommend using Grafana.
Getting the Metrics URL
- Log in to the Integration Portal with your Dronetag account, or create a new one.
- Find the distribution target you're interested in and click View & Edit.
- Click the Get Prometheus Metrics button.
- You’ll see the metrics in Prometheus/OpenMetrics format.
- Use your preferred tool to scrape this URL periodically (see the next section for more details).
The URL format will look like this:
https://relay.dronetag.app/metrics/[[your_distribution_id]]
Make sure to note your distribution ID.
Scraping Metrics with Prometheus
Prometheus is an open-source monitoring system that can scrape our metrics export. To learn more and find installation instructions, refer to the official Prometheus documentation.
Here’s a recommended configuration to start scraping our metrics:
global:
  scrape_interval: 10s
scrape_configs:
  - job_name: 'dronetag_distribution_metrics'
    scrape_interval: 10s
    metrics_path: '/metrics/[[your_distribution_id]]'
    static_configs:
      - targets: ['relay.dronetag.app']
This configuration will scrape metrics every 10 seconds from the URL: https://relay.dronetag.app/metrics/[[your_distribution_id]].
Available Metrics
| Name | Description |
|---|---|
relay_messages_read_total | Total number of messages read on the input |
relay_messages_distributed_total | Total number of messages distributed. This may be lower than the input due to filters or delivery failures. |
relay_message_conversion_seconds | Average time to convert a message to the selected output format (in seconds) |
relay_message_distribution_seconds | Average time to distribute a message to your target (in seconds), mostly representing server latency. |
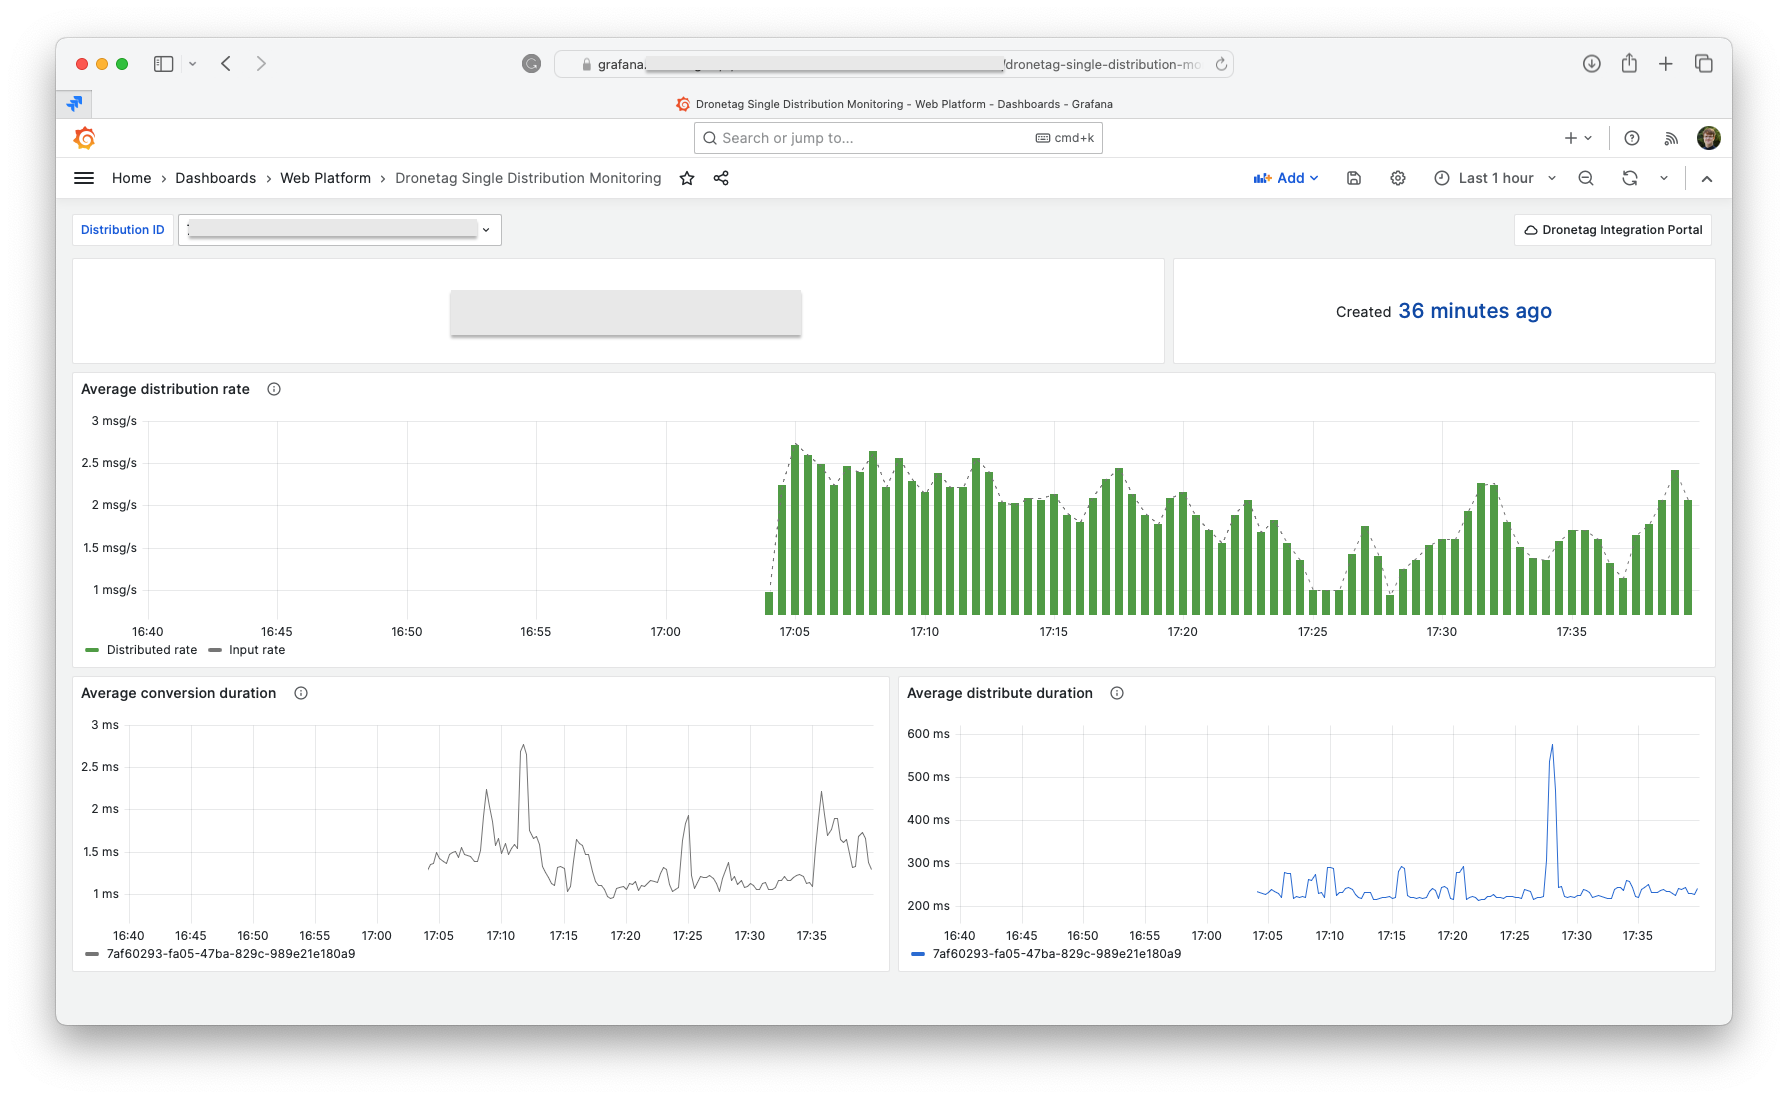
Visualizing Data with Grafana
Grafana is an open-source monitoring and analytics tool that works with Prometheus as a data source.
Check out the guide 'Get started with Grafana and Prometheus' to learn how to install Grafana and set up Prometheus as a data source.
Example Grafana Dashboard
We provide a basic Grafana dashboard example. You can import the JSON file into your Grafana instance and modify it to suit your needs.
Details
{ "annotations": { "list": [ { "builtIn": 1, "datasource": { "type": "grafana", "uid": "-- Grafana --" }, "enable": true, "hide": true, "iconColor": "rgba(0, 211, 255, 1)", "name": "Annotations & Alerts", "target": { "limit": 100, "matchAny": false, "tags": [], "type": "dashboard" }, "type": "dashboard" } ] }, "editable": true, "fiscalYearStartMonth": 0, "graphTooltip": 0, "id": 47, "links": [ { "asDropdown": false, "icon": "cloud", "includeVars": false, "keepTime": false, "tags": [], "targetBlank": false, "title": "Dronetag Integration Portal", "tooltip": "", "type": "link", "url": "https://integrations.dronetag.app" } ], "liveNow": false, "panels": [ { "datasource": { "type": "prometheus", "uid": "aRT0ZzYnk" }, "fieldConfig": { "defaults": { "color": { "mode": "thresholds" }, "mappings": [], "thresholds": { "mode": "absolute", "steps": [ { "color": "dark-purple", "value": null } ] }, "unit": "string" }, "overrides": [] }, "gridPos": { "h": 3, "w": 16, "x": 0, "y": 0 }, "id": 3, "options": { "colorMode": "value", "graphMode": "none", "justifyMode": "auto", "orientation": "horizontal", "reduceOptions": { "calcs": [ "lastNotNull" ], "fields": "/^relay_distribution_name$/", "values": false }, "text": { "valueSize": 40 }, "textMode": "value" }, "pluginVersion": "10.1.1", "targets": [ { "datasource": { "type": "prometheus", "uid": "aRT0ZzYnk" }, "editorMode": "code", "expr": "relay_messages_read_created{distribution_id=\"$distribution_id\"}", "format": "table", "instant": false, "legendFormat": "__auto", "range": true, "refId": "A" } ], "transformations": [], "type": "stat" }, { "datasource": { "type": "prometheus", "uid": "aRT0ZzYnk" }, "fieldConfig": { "defaults": { "color": { "mode": "thresholds" }, "mappings": [], "thresholds": { "mode": "absolute", "steps": [ { "color": "green", "value": null }, { "color": "dark-blue", "value": 80 } ] }, "unit": "dateTimeFromNow" }, "overrides": [] }, "gridPos": { "h": 3, "w": 8, "x": 16, "y": 0 }, "id": 2, "options": { "colorMode": "value", "graphMode": "none", "justifyMode": "center", "orientation": "horizontal", "reduceOptions": { "calcs": [ "lastNotNull" ], "fields": "/^Created$/", "values": false }, "textMode": "value_and_name" }, "pluginVersion": "10.1.1", "targets": [ { "datasource": { "type": "prometheus", "uid": "aRT0ZzYnk" }, "editorMode": "code", "expr": "relay_messages_read_created{distribution_id=\"$distribution_id\"}", "format": "time_series", "instant": false, "legendFormat": "Created at", "range": true, "refId": "A" } ], "transformations": [ { "id": "calculateField", "options": { "alias": "Created", "binary": { "left": "Created at", "operator": "*", "reducer": "sum", "right": "1000" }, "mode": "binary", "reduce": { "reducer": "sum" }, "replaceFields": true } } ], "type": "stat" }, { "datasource": { "type": "prometheus", "uid": "aRT0ZzYnk" }, "description": "Average rates of sent (distributed) messages. Dotted line shows source input rate, which can be higher if there are filters applied (such as filter to specific device group).", "fieldConfig": { "defaults": { "color": { "mode": "palette-classic" }, "custom": { "axisCenteredZero": false, "axisColorMode": "text", "axisLabel": "", "axisPlacement": "auto", "barAlignment": 0, "drawStyle": "bars", "fillOpacity": 100, "gradientMode": "none", "hideFrom": { "legend": false, "tooltip": false, "viz": false }, "insertNulls": false, "lineInterpolation": "linear", "lineWidth": 0, "pointSize": 5, "scaleDistribution": { "type": "linear" }, "showPoints": "never", "spanNulls": false, "stacking": { "group": "A", "mode": "none" }, "thresholdsStyle": { "mode": "off" } }, "mappings": [], "thresholds": { "mode": "absolute", "steps": [ { "color": "green", "value": null }, { "color": "red", "value": 80 } ] }, "unit": "mps" }, "overrides": [ { "matcher": { "id": "byName", "options": "Input rate" }, "properties": [ { "id": "custom.lineWidth", "value": 1 }, { "id": "custom.lineStyle", "value": { "dash": [ 2, 6 ], "fill": "dot" } }, { "id": "color", "value": { "mode": "fixed" } }, { "id": "custom.drawStyle", "value": "line" }, { "id": "custom.fillOpacity", "value": 0 } ] } ] }, "gridPos": { "h": 8, "w": 24, "x": 0, "y": 3 }, "id": 1, "interval": "15s", "maxDataPoints": 128, "options": { "legend": { "calcs": [], "displayMode": "list", "placement": "bottom", "showLegend": true }, "tooltip": { "mode": "single", "sort": "none" } }, "targets": [ { "datasource": { "type": "prometheus", "uid": "aRT0ZzYnk" }, "editorMode": "code", "expr": "sum(rate(relay_messages_distributed_total{distribution_id=\"$distribution_id\"}[$__rate_interval])) by (distribution_id)", "instant": false, "legendFormat": "Distributed rate", "range": true, "refId": "A" }, { "datasource": { "type": "prometheus", "uid": "aRT0ZzYnk" }, "editorMode": "code", "expr": "sum(rate(relay_messages_read_total{distribution_id=\"$distribution_id\"}[$__rate_interval])) by (distribution_id)", "hide": false, "instant": false, "legendFormat": "Input rate", "range": true, "refId": "B" } ], "title": "Average distribution rate", "type": "timeseries" }, { "datasource": { "type": "prometheus", "uid": "aRT0ZzYnk" }, "description": "The duration of how long it takes to convert the source input data to the output format. Includes filtering or other data pre-processing.", "fieldConfig": { "defaults": { "color": { "mode": "fixed", "seriesBy": "last" }, "custom": { "axisCenteredZero": false, "axisColorMode": "text", "axisLabel": "", "axisPlacement": "auto", "barAlignment": 0, "drawStyle": "line", "fillOpacity": 0, "gradientMode": "none", "hideFrom": { "legend": false, "tooltip": false, "viz": false }, "insertNulls": false, "lineInterpolation": "linear", "lineWidth": 1, "pointSize": 5, "scaleDistribution": { "type": "linear" }, "showPoints": "auto", "spanNulls": false, "stacking": { "group": "A", "mode": "none" }, "thresholdsStyle": { "mode": "line" } }, "mappings": [], "thresholds": { "mode": "absolute", "steps": [ { "color": "blue", "value": null } ] }, "unit": "s" }, "overrides": [] }, "gridPos": { "h": 8, "w": 12, "x": 0, "y": 11 }, "id": 4, "interval": "15s", "options": { "legend": { "calcs": [], "displayMode": "list", "placement": "bottom", "showLegend": true }, "tooltip": { "mode": "single", "sort": "none" } }, "targets": [ { "datasource": { "type": "prometheus", "uid": "aRT0ZzYnk" }, "editorMode": "code", "expr": "sum(rate(relay_message_conversion_seconds_sum{distribution_id=\"$distribution_id\"}[$__rate_interval]) / rate(relay_message_conversion_seconds_count{distribution_id=\"$distribution_id\"}[$__rate_interval])) by (distribution_id)", "instant": false, "legendFormat": "__auto", "range": true, "refId": "A" } ], "title": "Average conversion duration", "type": "timeseries" }, { "datasource": { "type": "prometheus", "uid": "aRT0ZzYnk" }, "description": "The duration of how long it takes to distribute the data. The largest part is usually the server latency. Some distribution types can be missing a support for this metric.", "fieldConfig": { "defaults": { "color": { "mode": "thresholds", "seriesBy": "max" }, "custom": { "axisCenteredZero": false, "axisColorMode": "text", "axisLabel": "", "axisPlacement": "auto", "barAlignment": 0, "drawStyle": "line", "fillOpacity": 0, "gradientMode": "none", "hideFrom": { "legend": false, "tooltip": false, "viz": false }, "insertNulls": false, "lineInterpolation": "linear", "lineWidth": 1, "pointSize": 5, "scaleDistribution": { "type": "linear" }, "showPoints": "auto", "spanNulls": false, "stacking": { "group": "A", "mode": "none" }, "thresholdsStyle": { "mode": "dashed" } }, "mappings": [], "thresholds": { "mode": "absolute", "steps": [ { "color": "blue", "value": null }, { "color": "dark-orange", "value": 0.7 }, { "color": "semi-dark-red", "value": 1 } ] }, "unit": "s" }, "overrides": [] }, "gridPos": { "h": 8, "w": 12, "x": 12, "y": 11 }, "id": 5, "interval": "15s", "options": { "legend": { "calcs": [], "displayMode": "list", "placement": "bottom", "showLegend": true }, "tooltip": { "mode": "single", "sort": "none" } }, "targets": [ { "datasource": { "type": "prometheus", "uid": "aRT0ZzYnk" }, "editorMode": "code", "expr": "sum(rate(relay_message_distribution_seconds_sum{distribution_id=\"$distribution_id\"}[$__rate_interval]) / rate(relay_message_distribution_seconds_count{distribution_id=\"$distribution_id\"}[$__rate_interval])) by (distribution_id)", "instant": false, "legendFormat": "__auto", "range": true, "refId": "A" } ], "title": "Average distribute duration", "type": "timeseries" } ], "refresh": "", "schemaVersion": 38, "style": "dark", "tags": [ "dronetag" ], "templating": { "list": [ { "current": { "selected": false, "text": "cc2129b7-30e4-469e-8b13-92e7e097d528", "value": "cc2129b7-30e4-469e-8b13-92e7e097d528" }, "datasource": { "type": "prometheus", "uid": "aRT0ZzYnk" }, "definition": "label_values(relay_messages_read_total,distribution_id)", "hide": 0, "includeAll": false, "label": "Distribution ID", "multi": false, "name": "distribution_id", "options": [], "query": { "query": "label_values(relay_messages_read_total,distribution_id)", "refId": "PrometheusVariableQueryEditor-VariableQuery" }, "refresh": 1, "regex": "", "skipUrlSync": false, "sort": 0, "type": "query" } ] }, "time": { "from": "now-1h", "to": "now" }, "timepicker": { "nowDelay": "", "refresh_intervals": [ "5s", "10s", "30s", "1m", "5m" ] }, "timezone": "", "title": "Dronetag Single Distribution Monitoring", "uid": "f2370455-bdac-4098-baf5-ea8857bc199d", "version": 5, "weekStart": "" }